Difference between revisions of "SMAData"
| (2 intermediate revisions by one user not shown) | |||
| Line 1: | Line 1: | ||
| − | == SMAData (smart meters alarm dataset) | + | == SMAData (smart meters alarm dataset) == |
The '''SMAData''' is a new dataset containing power quality (PQ) alarms from 1033 smart meters (SMs) for a four months period. The SMs used in here are able to record up to 200 PQ disturbances per day. Whenever the PQ parameters are outside the configured thresholds, SMs will record an "alarm". The recorded data from SMs are sent to the base center at the company once per day. When the alarm log is full, the oldest alarms are over-written. Therefore, in our modification of SMs, the time and value thresholds are selected to collect as many alarms as possible without saturating the SMs' memory. | The '''SMAData''' is a new dataset containing power quality (PQ) alarms from 1033 smart meters (SMs) for a four months period. The SMs used in here are able to record up to 200 PQ disturbances per day. Whenever the PQ parameters are outside the configured thresholds, SMs will record an "alarm". The recorded data from SMs are sent to the base center at the company once per day. When the alarm log is full, the oldest alarms are over-written. Therefore, in our modification of SMs, the time and value thresholds are selected to collect as many alarms as possible without saturating the SMs' memory. | ||
| Line 59: | Line 59: | ||
---------------------------------------------------- | ---------------------------------------------------- | ||
| − | + | <div style="font-size: 120%;">'''Please include an appropriate citation to acknowledge the use of the SMAData:'''</div> | |
Latest revision as of 18:09, 6 January 2019
Contents
SMAData (smart meters alarm dataset)
The SMAData is a new dataset containing power quality (PQ) alarms from 1033 smart meters (SMs) for a four months period. The SMs used in here are able to record up to 200 PQ disturbances per day. Whenever the PQ parameters are outside the configured thresholds, SMs will record an "alarm". The recorded data from SMs are sent to the base center at the company once per day. When the alarm log is full, the oldest alarms are over-written. Therefore, in our modification of SMs, the time and value thresholds are selected to collect as many alarms as possible without saturating the SMs' memory.
Explanation of the dataset features (download link below)
1. SMs' ID
This column corresponds to the ID of the SMs. Every SM has a unique ID.
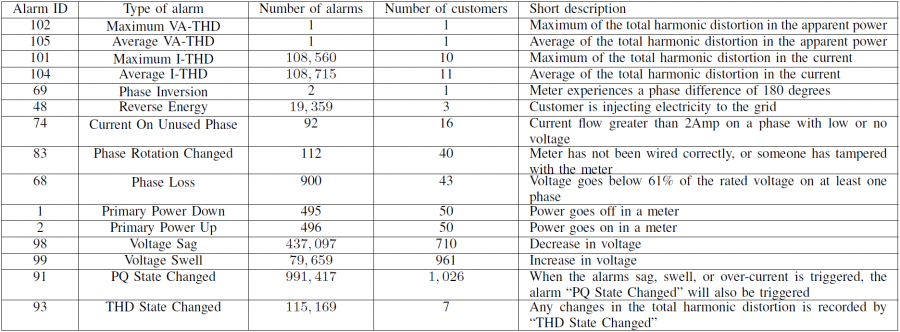
2. Alarm ID
This column corresponds to the type of alarm. The information about the alarm ID with the corresponding type, a short description about the alarm, and number of alarms for each type of power quality deviations with the corresponding number of customers generating them is presented in the following table.
3. Date and Time
This column represent the date and time when an alarm has happened.
4. Alarm Type
Contain information about in which phases an specific alarm has occurred.
5. Value
For some of the power quality deviations such as sag and swell this column represents the amount of deviations. For other type of alarms, this column might be filled with 0 or NaN.
6. Sub-station ID
This column corresponds to the sub-station in which the SMs are connected to.
7. Branch
The column corresponds to the branch number of the tree-structure of the grid topology for each sub-station where the SMs connected to.
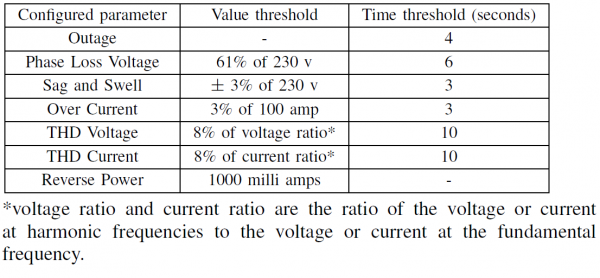
Explanation of the reconfigured parameters
The reconfigured parameters with their corresponding threshold are listed in the following table. The sensitivity of other parameters has not been changed from default values.


